📊
Source Tables & Downstream Charts
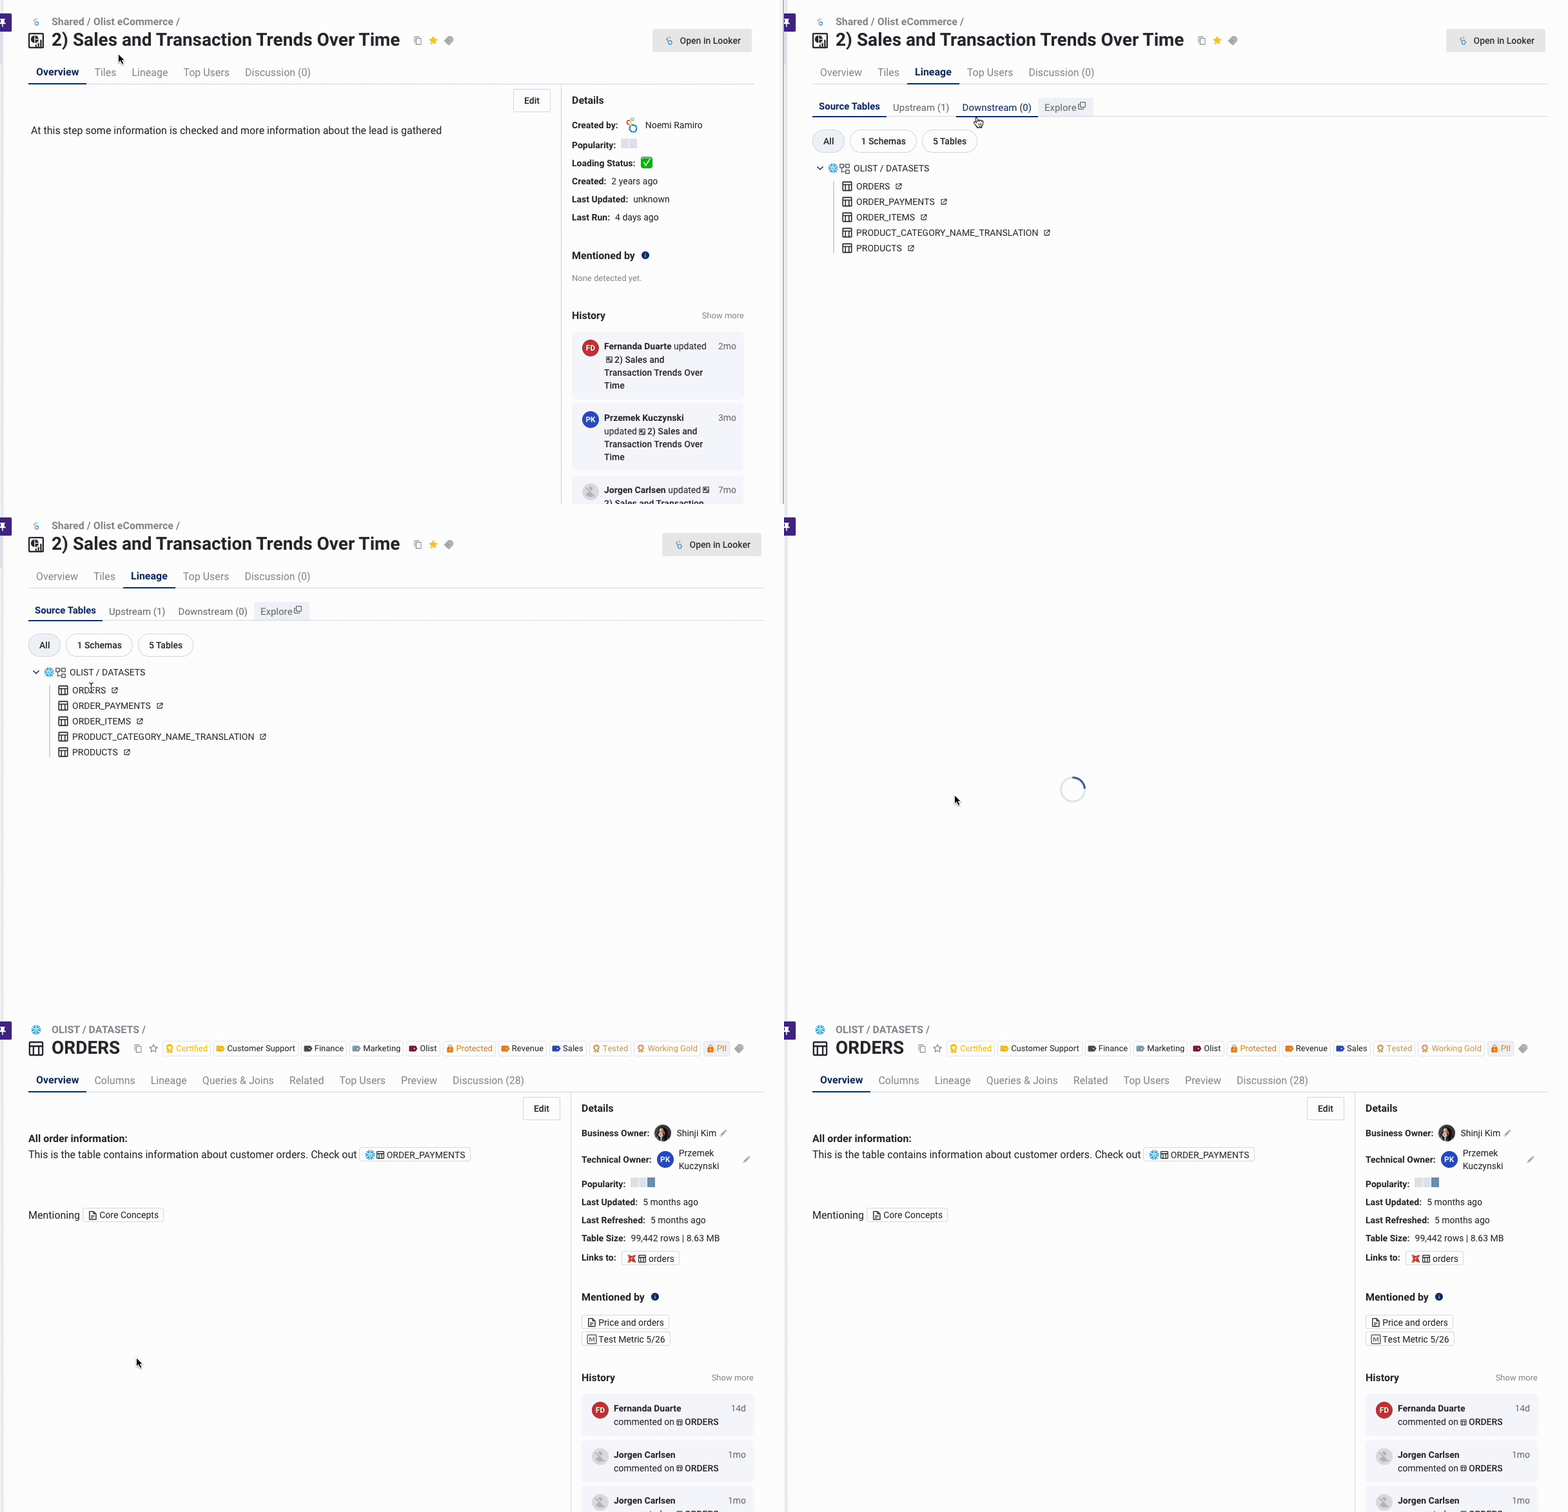
To understand which tables the dashboard is coming from, you might have to click through the multiple levels of BI data model today. We're introducing Source Tables to be able to give you a summary of all direct tables today.
Source Tables - first level of upstream tables of the dashboard:
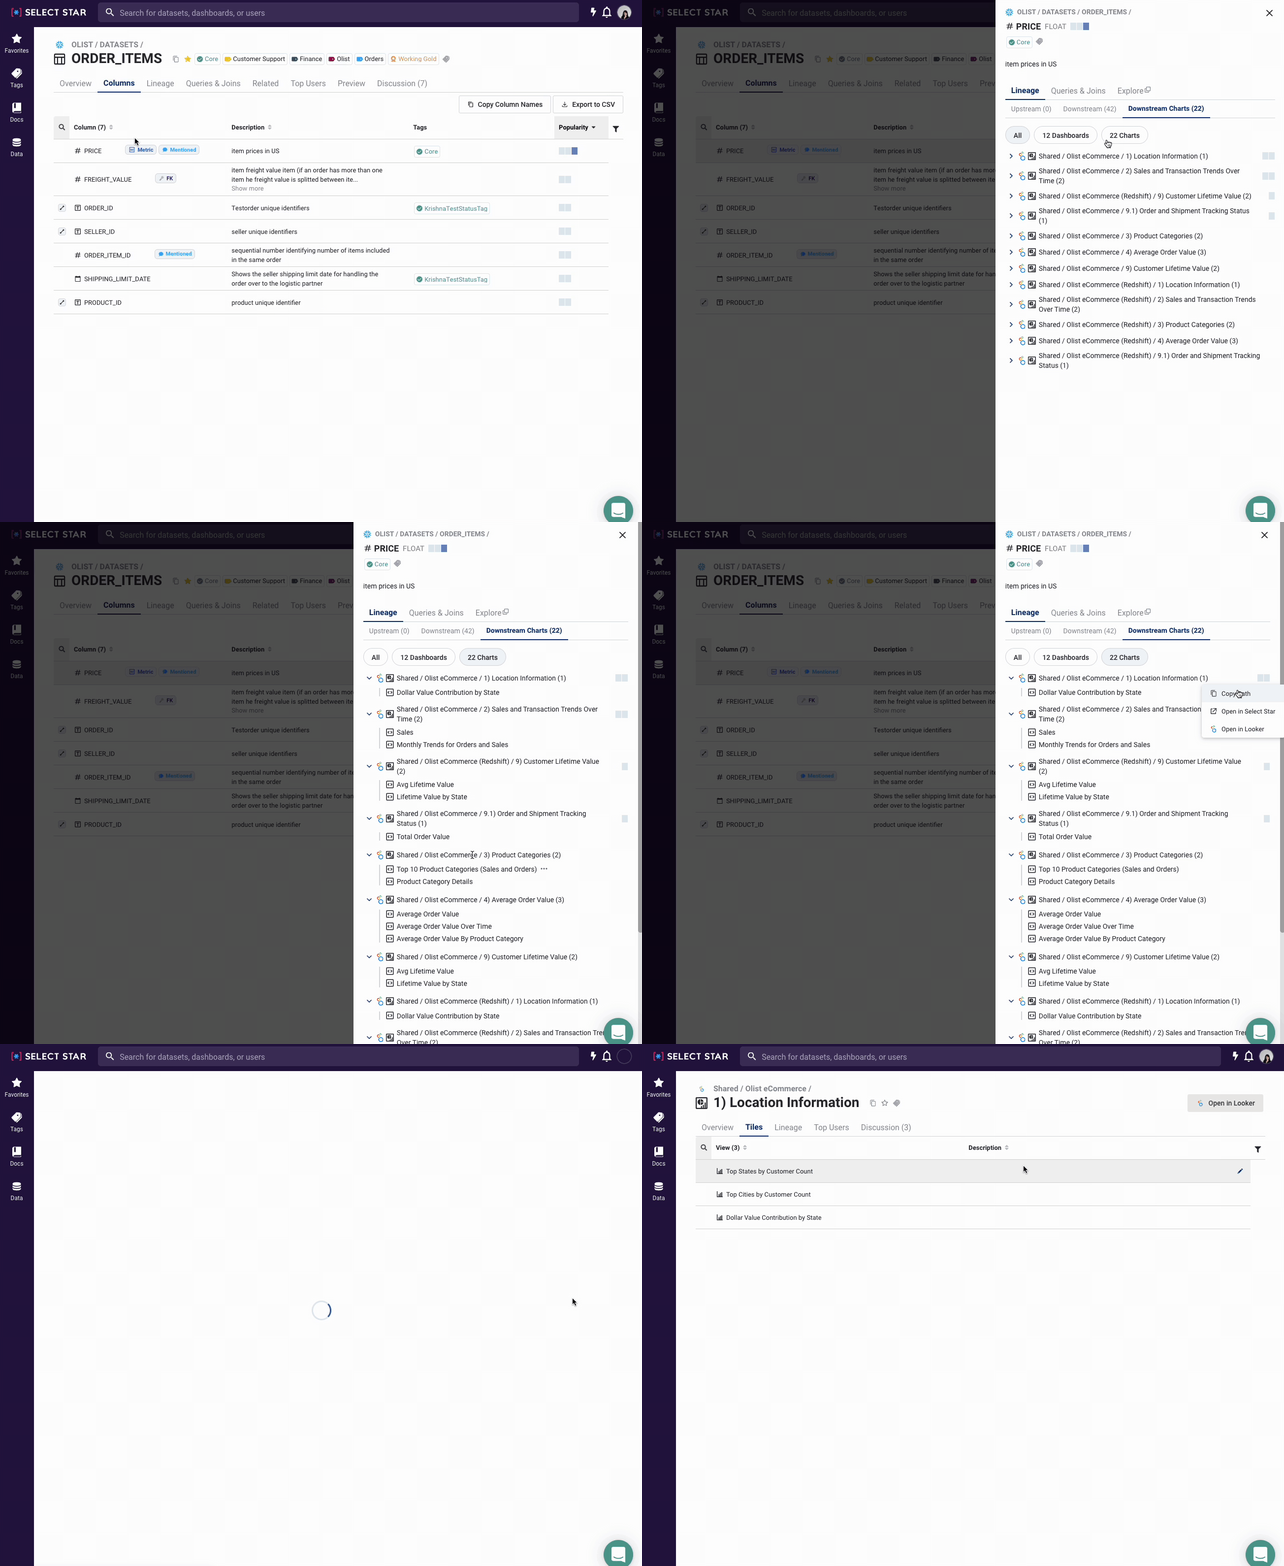
Similarly, we are also introducing Downstream Charts similar to Downstream Dashboards tab under lineage.
Downstream Charts - list of downstream dashboards & charts per column:
✨
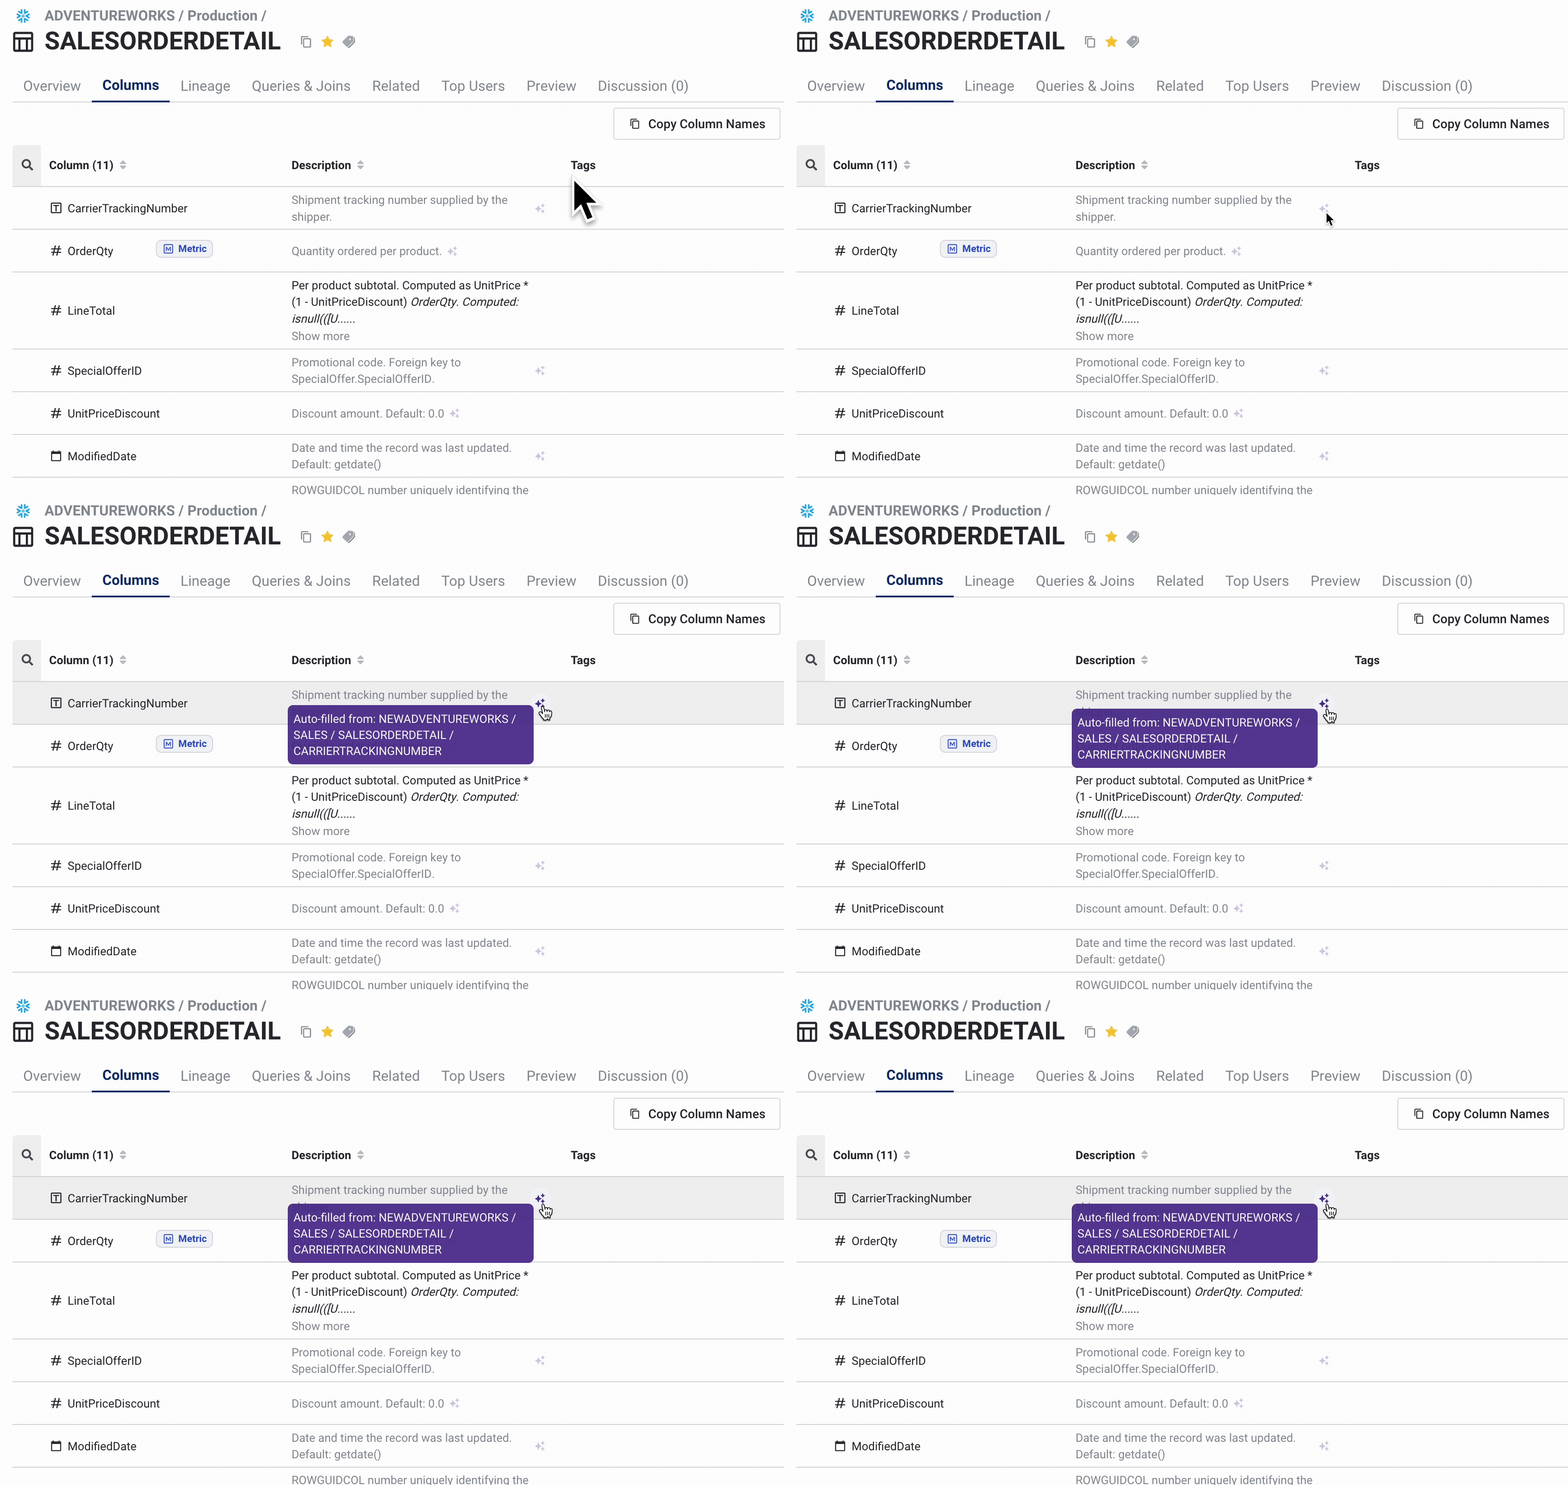
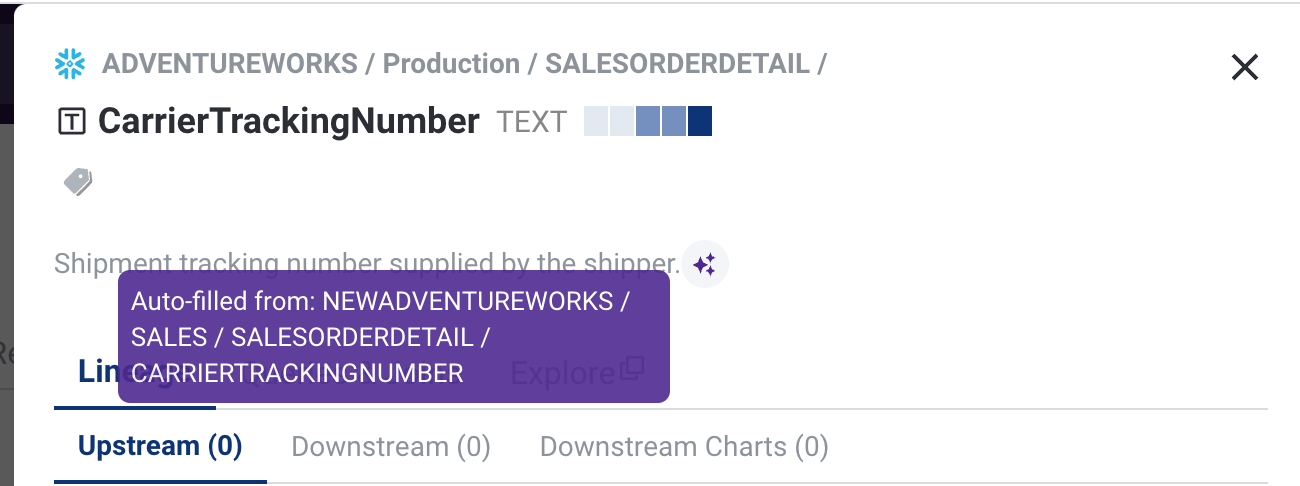
Suggested Description Source
The auto-propagated description is one of our most-loved features. To give more context to it, we start to show where it comes from with the✨ icon.
🏷
Suggested Tags
Select Star will automatically tag asset types with relevant tags from upstream and downstream fields where data is directly propagated.
Select Star will also mark PII tags if the table includes any PII tagged columns.
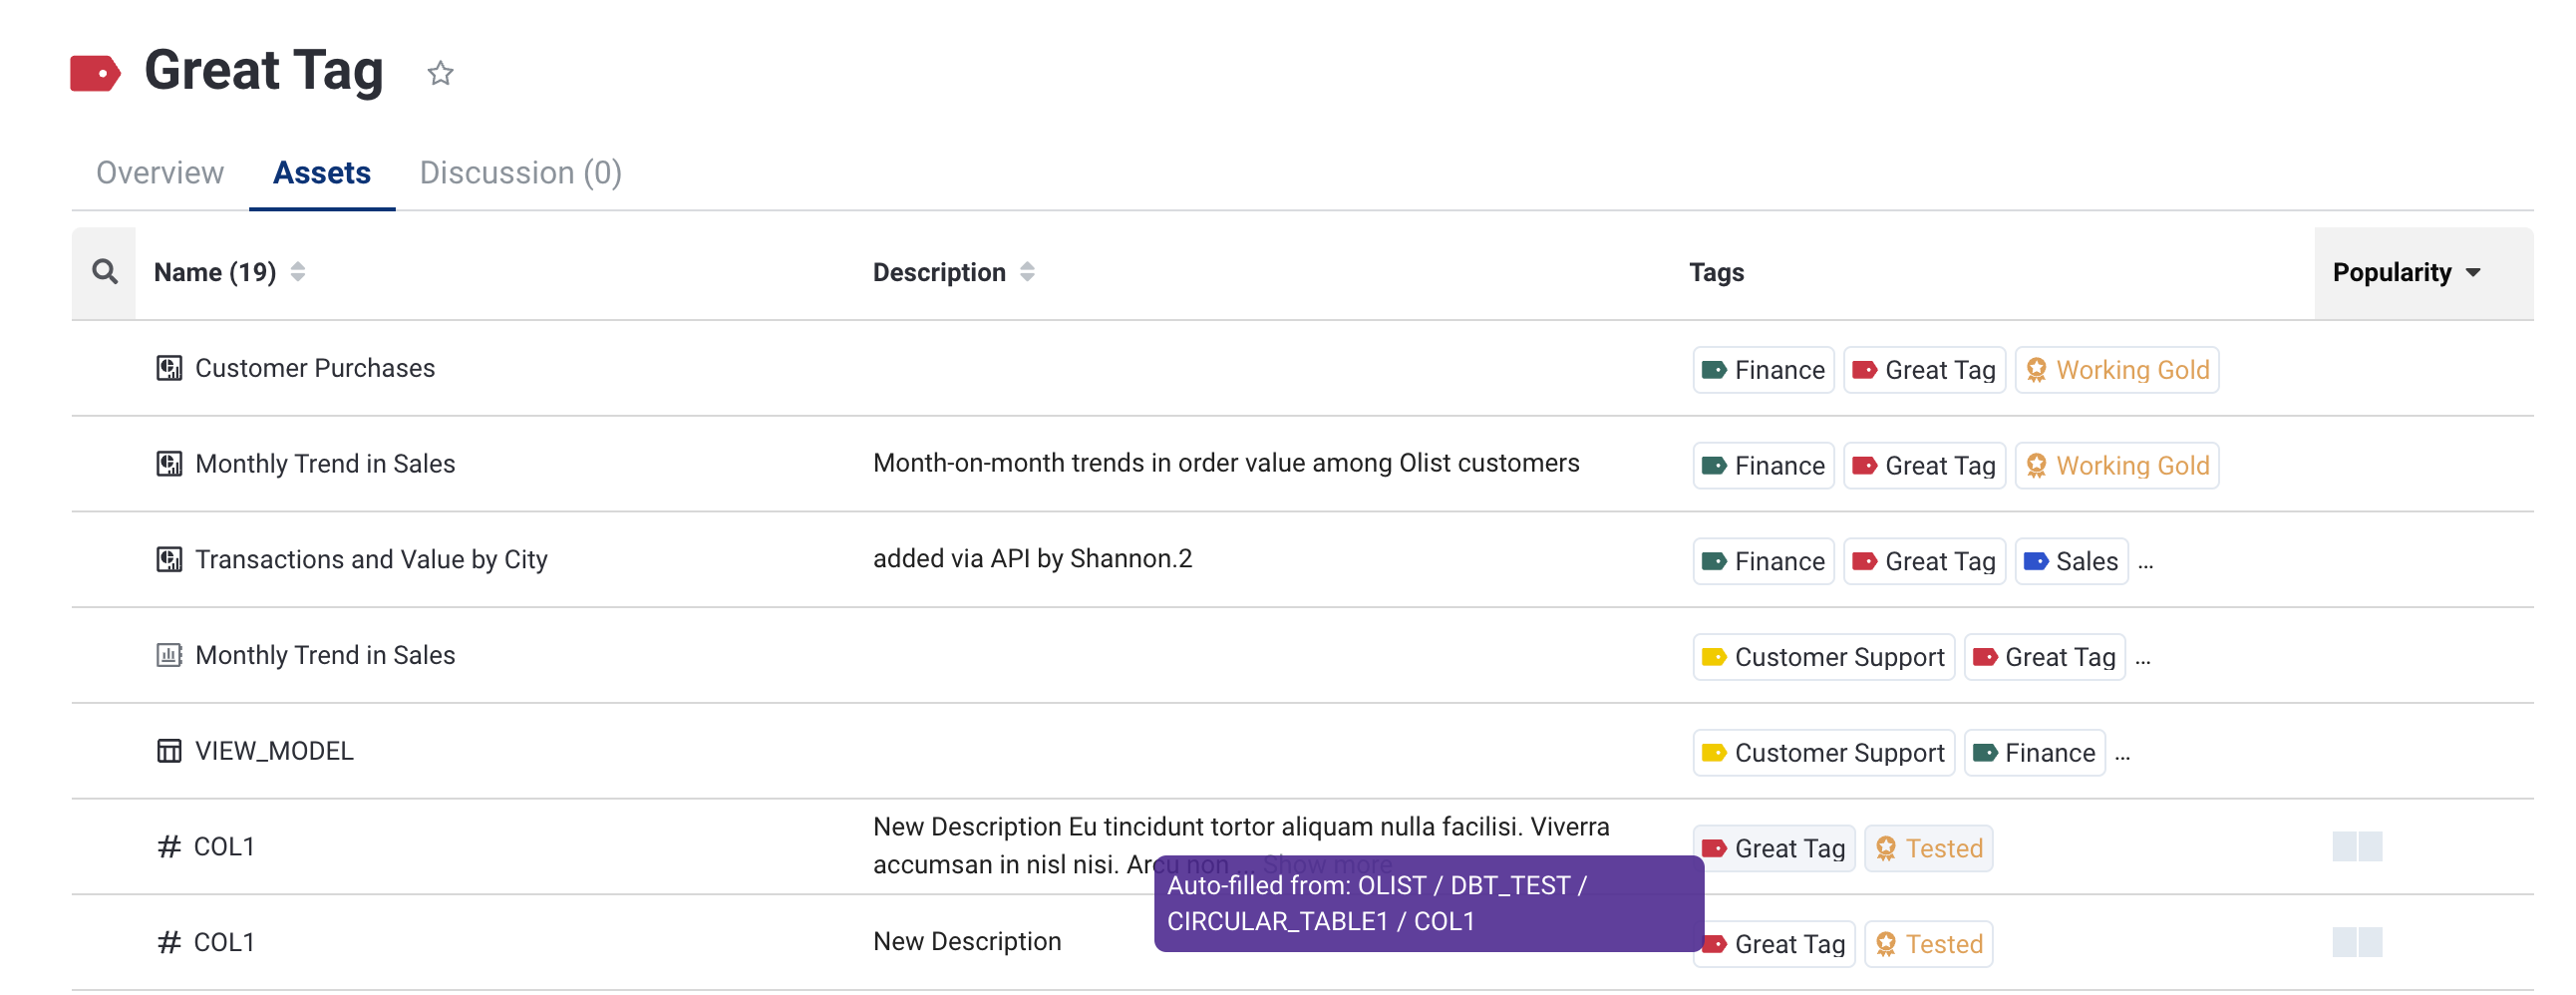
👆 Suggested tags show up in a grey background. Upon hover, you can see where the tag is auto-filled from.
It's always feeling excited when we bring some product update news! Have a great weekend everyone!